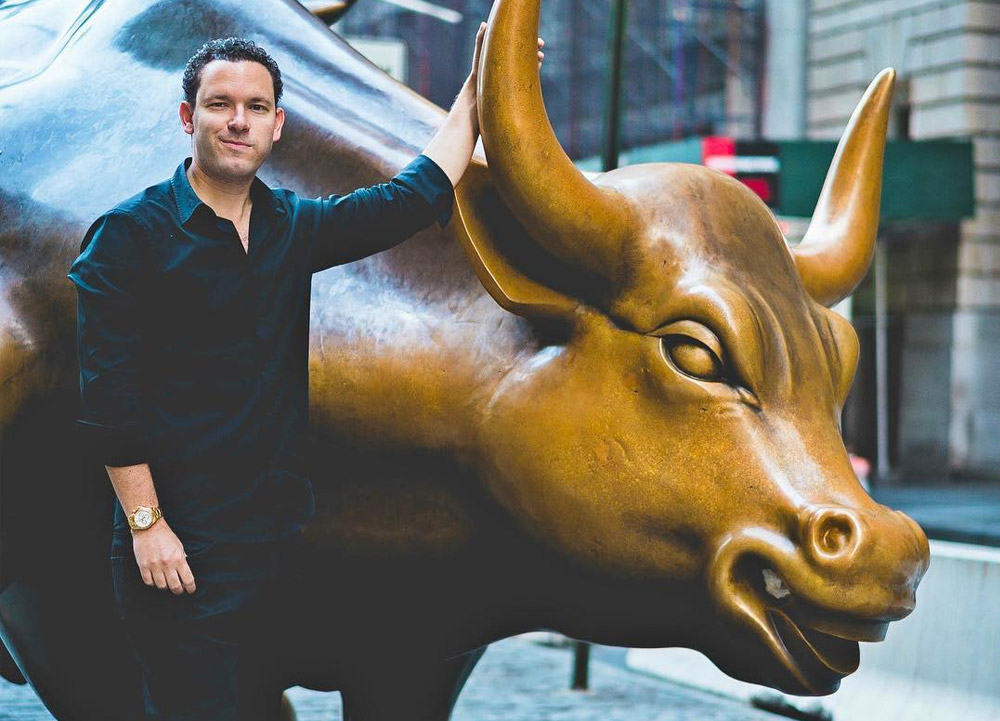
I’ve been trading for over 20 years now. And during that time I’ve utilized a handful of patterns.
But after two decades, there’s one pattern that stands out from the rest. And I’ll show it to you in just a bit.
There isn’t a single pattern responsible for all my $7.3 million in trading profits, but the one you’re about to discover is responsible for a lot of the heavy lifting.
I’ve played it in hot and slow markets alike. And it’s easy to identify. You’ll see…
Yesterday I Made +10% With It

Here’s what I mean. Even with…
… I’ve still been able to profit. And this pattern is one of the biggest reasons why.
This pattern is called the panic dip buy. (Learn more about it here.)
Now, trading isn’t an exact science, which means you can’t learn this pattern from one chart. Different stocks will never behave exactly the same.
What’s more important is to understand the process to potentially profit.
That said, here’s the main idea behind this pattern…
When a stock falls too much, there’s often a correctional bounce. That means if the price falls a lot, at the end of that fall, it’ll bounce as traders look to buy shares for cheap.
That doesn’t mean you can just buy every price crash. Only some stocks will bounce, and even then, you never really know how far they’ll pop back up.
For example, yesterday I traded Kona Gold Beverage (OTC: KGKG) twice for a double profit.

Two trades for a couple of hundred dollars doesn’t seem like a lot. But that’s how traders make millions over time.
It’s impossible to trade a home-run stock every day. Mostly because there isn’t a home-run opportunity every day. You can only trade what the market gives you. That’s what I did here.
Let me break down my entry and exit…
How to Trade This Pattern
First of all, start with watching the right stocks.
I’m looking for volatile charts that have a lot of downside potential. Remember, I want to trade the bounce after the fall.
The best stocks to watch for panic dip buys are ones with overextended charts. Look at KGKG over the last three months up until March 12. It spiked way past the breakout level.

This kind of growth is unsustainable, especially for garbage penny stocks. You never know how far they’ll go. But just like gravity, what goes up must come down.
After a few green days, I finally saw my chance to profit.
Newbie traders love to ask me, “How much panic is enough?”
Great question. If there’s not enough panic, the stock won’t bounce. I like at least a 20% price drop for a potentially profitable bounce.
Check out this KGKG intraday chart. On the first dip I bought, the price had dropped 16% from highs.

I know that’s not 20%. I decided to buy the dip considering how overextended the stock was. That’s what I mean when I say trading is an inexact science. Every trade’s a little different, like a snowflake.
When the bounce topped out, I sold for a 5% profit. But as it continued lower, I knew more panic meant another possible bounce.
So I bought back in after a 21% drop from the HOD and took another 5% profit.
Trades like these are how I’ve made millions as a day trader.
Most newbies are swinging for the fences on every trade. I focus on taking the meat of the move and cutting losses quickly.
Learn All the Patterns I Trade

Hands down, this is my favorite setup. But it’s not the only one I use.
For example, I have a breakout pattern to help me catch supernova price spikes. Like $KGKG’s run before I dip bought the panic. Study up on that strategy here.
If you’re serious about making money in this industry, you must find the patterns that work for you.
I have 20+ millionaire students now, and we all trade a little differently. They used to be where you are. Then they joined the Challenge and learned to trade. Want to become my next student?
Start studying today. Don’t wait around for the money. Go get it!
Have you heard of a panic dip buy before? What patterns do you use to trade? Let’s find out which patterns we have in common — leave a comment below!
The post This Pattern Made Me a Millionaire appeared first on Timothy Sykes.
